Abstract
Injection molds are increasingly making use of high strength, high thermal conductivity copper alloy mold components to reduce cycle time and improve dimensional accuracy. Molders are focused on the durability of these components. This paper is the first of a two-part discussion of erosive wear. Performance of standard copper alloys and tool steels was compared. Wear measurements were taken on a flat surface across from the gate, on the core side of the mold. Samples were run without release or lubrication aides, using 33% glass-filled nylon. Uncoated copper alloys were found to have comparable performance to that of pre-hardened tool steel.
Introduction
Mold building practice has seen steady change in recent years, especially in the area of off-the-shelf components. Changes in design systems, driven by advances in computer aided design (CAD) and computer aided engineering (CAE), coupled with improvements in measurement systems used for dimensional metrology have yielded more precise tools.
Recently, much research has been conducted with the objective of optimizing mold cooling with the use of high strength, high thermal conductivity copper alloy components 1-4 . In this area, perceptible change can be seen in new tools entering production. However, resistance to application of high strength copper alloys still centers around concerns about the longevity of high thermal conductivity copper alloys due to their perceived wear characteristics. Long term wear studies of copper and steel components with and without protective plating and coating has been underway at Western Michigan University since 1997. This paper is the first of a two-part discussion of the effects of erosive wear on molding surfaces. These papers build on previous discussions about the relationship between wear rate and part wall thickness, as well as the definition and explanation of various wear mechanisms that may affect components in a mold 5, 6 . A review of the two aforementioned papers will significantly improve the reader's ability to correctly apply the data that follow.
Over 1.5 million shots have been run on the test mold with the sole objective to wear out mold components. Through the course of this study, data have been gathered on the wear characteristics of a variety of mold components. This discussion focuses on erosive wear of unplated mold cores. These data reflect the wear rate of both alloy coppers and tool steels in an erosive environment. The gate area chosen for this study should be reflective of other types of gates as well as other potential erosion sites within a mold.
Description of Equipment
Mold
The experiment used a geometrically balanced eight-cavity mold with .76 x .76 mm (.030" x .030") edge gate and minimal draft (less than 1° per side). A DME straight-shot hot sprue bushing was used. The mold also had guided ejection and four mold interlocks.
Both the A and B plates were cooled using ¼ NPT water lines configured in a single circuit around the perimeter of the tool. Four baffles on each side of the tool delivered water closer to the cavities. Coolant temperature was set to 18° C (65° F). The cores were cooled by a copper-alloy chill-plate mounted on the back of the tool.
Part
The parts were 1.5 mm (.06") thick round chips, 19 mm (.75") in diameter with a 5 mm (.20") high wall running around their perimeter. A flat was formed on the inside of each part by a flat cut into the core pin ( Figure 1). The wall thickness of the outside wall was reduced to .71mm (.028) in the area of the flat. This flat was positioned directly opposite of the gate and was the first area of resin contact inside the cavity
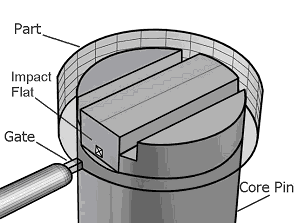 Figure 1. Cavity Design
Material
The material used in the study was 33% glass-filled Nylon 6 supplied by Allied Signal. A glass-filled material was chosen because of the high potential for tool wear due to the glass fibers. Prior to molding, the nylon was dried in a Una-Dyn drier to a moisture content of .030% or lower. An Arizona Instruments MAX-2000 moisture analyzer was used to monitor moisture content before and after runs. Shots that were not retained were ground by a nine-blade Conair auger-fed grinder with a screen size of 5mm (3/16). After grinding, the resin was fed through a cascade aspirator to remove fines. Material conveyance was performed using AutoLoad vacuum accelerators.
Material was segregated by regrind generation, no mixing was allowed between material generations. Previous research has shown that when used in this generation-homogenous manner, the material properties change drastically by the third generation 7 . Therefore, material was not used beyond the second generation.
Additional Equipment
All molding was conducted with a 77 metric ton (85-ton) VanDorn hydraulic toggle injection-molding machine having a 35 mm (1? ") diameter screw and a 20.6 cc (5 ounce) maximum shot size. An AEC mold temperature controller regulated mold coolant temperature. Coolant flow rate, input and output temperatures, and pressure loss was monitored in all cooling circuits.
Design of Experiment & Methodology
Dependent variables included the wear measured at the point of resin impact ( Figure 1), the number of cycles to failure, and objective visual observations made at the time of measurement (e.g. scratches, chips, discoloration, etc.) Independent variables included the core substrate material and material regrind generation. The most aggressive component of erosive wear was assumed to be the effects of the glass fibers present in the resin. Three generations of material were used (virgin through second-generation regrind). The effects on core life, due to material generation, if any, were to be analyzed.
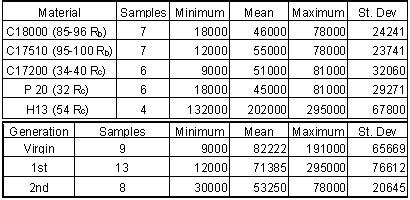
The copper alloys used in this study included C18000, C17510, and C17200
 |
The order of installation of the material treatments for the first set of pins was established randomly. After running the tool for a maximum of 6000 shots, the cores were removed and measurements and visual observations were made on each core pin. When the tool was reassembled, each pin was installed the cavity adjacent to the cavity it had been removed from ( Figure 2). Once a core had been used in all cavities, the pattern was repeated. This practice of changing the cavity position was used in order to reduce any effects due to small differences between the cavities.
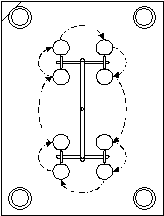 Figure 2. Core Position Rotation
This procedure was followed until the maximum depth of erosion on the impact flat exceeded the failure criterion of .005mm (.0002). Failed cores were removed from the installed set of cores and were replaced by the next pin in the randomized installation order took.
Core pins in the second material treatment set were installed four cavity positions away from the initial installation cavity of the core of the same material in the first set. After the first 6000 cycles, the previously discussed cavity change procedures were followed. Again, these procedures were used to increase the likelihood that all materials were used in all cavities of the tool. The initial cavity position of cores in the treatment sets beyond the second set was established randomly.
Measurement Procedures
Both a custom-built gage and a WYKO interference microscope were used to collect measurements. Initial measurements were made before the cores were inserted in the tool. After a maximum of 6000 cycles, the pins were removed from the mold and visually inspected. During the inspection, the resin impact flat and the side of the pin were measure with the gage. The gage measured one point on the impact flat in comparison to a P20 zero pin. The zero pin was held as the control in the experiment.
Measurement precision was .0005 mm (.00002). Gage repeatability and reproducibility (R&R) using ANOVA methods were used to validate the measurement methods. These studies showed that 99% of the gage measurement variance was due to part variance.
The gage measurements were considered preliminary measurements and were used to establish the trend in wear rate. Measurements were taken with a WYCO RST-plus vertical interference microscope 8 . The measurement methodology used provided a vertical resolution of .003 microns and a lateral resolution of 23 microns. The microscope provided a color-enhanced image of shape of the wear cavity and surface traces equivalent to profilometer traces. From these traces, the maximum depth of the eroded depression was determined.
Findings
Mean values for the number of cycles-to-failure for each core material and generation of regrind are shown in Table 1. The generation of regrind used was not found to have a significant effect (p>.05) upon the life of the core pin. The mean value and range of the cycles-to-failure for each material treatment is shown in Figure 3. From this graph it can be seen that the copper alloys and P20 performed similarly. Indeed, no significant differences (p<.05) were found between the cycles-to-failure of P20 and the copper alloys.
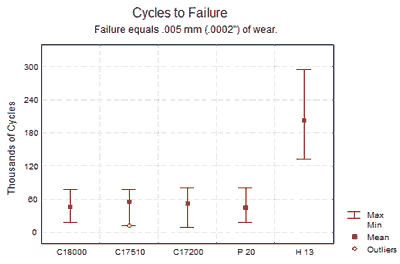 Figure 3. Cycles-to-Failure
However, there was a significant difference between H13 and the other materials. Differences between the material treatments were evaluated using an X-Bar and R chart ( Figure 4). To simulate a 95% confidence interval, +/-1.96 sigma control limits were drawn. The means and ranges for H13 fell out side the control limits indicating that H13 performed significantly different than the other materials (p<.05).
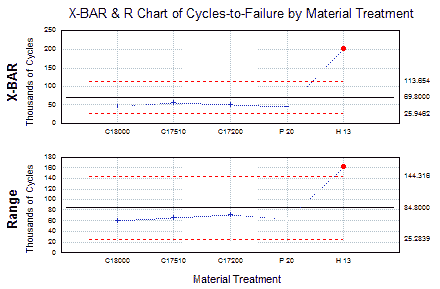 Figure 4. X-Bar and R Chart
Figure 5 shows the different manifestations of wear on the impact flat. These images were generated from the data collected by the interference microscope. It was expected that high-hardness materials would have a greater number of cycles-to-failure than low-hardness alloys. This assumption, however, did not consider the shape of the eroded surface. The data showed that C17200 exhibited a similar number of cycles-to-failure as that of the other copper alloys. The shape of the eroded depression may explain why the harder materials failed at similar rates as low-hardness alloys. Erosion formed a narrow, deep pit in the C17200 alloy (hardness values given in Table 1). On the softer materials (C18000 and C17510), it was generally observed that erosion formed a broad, shallow wash plane.
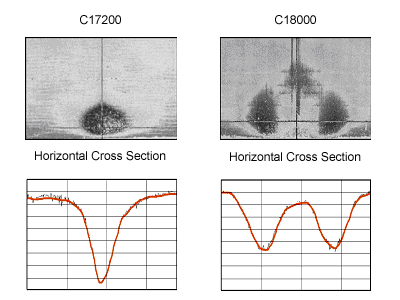 Figure 5. Graphics of Erosion for Interference Microscopy (dark colors are deeper)
From the gage data, graphs were generated showing the wear from zero to 100% of total cycles-to-failure (percent of useful core life). These curves illustrate the wear rates for the materials. Sample wear rate curves are shown in Figure 6. From these graphs, it can be seen that there is a linear relationship between the wear and the percent core life. However, if the core is run beyond failure, the distance between the gate and the impact flat increases. As this occurs, the wear rate decreases and the wear rate becomes nonlinear. This effect is supported by previously published wear data 5 .
Conclusions
Many in the industry may feel that copper alloys are softer than steel alloys and therefore wear more quickly. However, this investigation established that the cycles-to-failure was statistically the same for both P20 cores and cores of the three tested copper alloys. In erosive wear situations where high thermal conductivity materials are required, copper alloys may replace P20 without negatively affecting the useful life of cores.
The hardness of the mold surface will affect the shape of the erosion that occurs on that surface. Erosion formed deep, narrow furrows and pits in harder materials, while softer materials exhibited wider and shallower erosion planes. Consideration should be given prior mold construction, as to which of these two manifestations of wear is acceptable for the given application.
It should be noted that the wear rate of the P20 and the three tested copper alloys was regular and linear within the failure criteria. This implies that the number of cycles before a core needs to be repaired or replaced may be easily predicted. Even though wear occurs on these molding surfaces, it can be establish when maintenance will be required, prior to the production of unacceptable parts.
The cores made of H13 tool steel did exhibit a longer useful life than all other alloys tested. The tool steel H13 appears to be a good measure of the long-term wear characteristics of a tool component. In the second part of this paper on copper alloy tool wear, the wear characteristics of plated copper alloy cores were compared to H13 and P20.
Acknowledgements
The authors extend their appreciation to the Copper Development Association Inc. and its members for providing necessary support for this research. A special thanks is due to Honeywell/Allied Signal for providing the resin for the investigation. Research assistance was also provided by Dr. Dale Peters and Dr. Harold Michels of the Copper Development Association Inc. and the WMU Tribology Laboratory.
Each of the following students invested between 250 and 400 hours of work in the completion of this research: Kevin Andruszkiewicz, Eric Burgess, Eric Grant, Carlene Harris, Dennis Creedon, Thomas Hall, Leslie Shaw, Gregory Snitgen, Alicia Habercorn, Allen Woodruff, Ryan Brill, Jared Patterson, Troy Winningham, Rich Brothers, Adrian Sultana, Frank Asher, Mike Buckle, Jeff Lewis, Marshall Proulx, Jen Vanover, Leonid Fedorovitch, Keith Wilkenson, Mike Westra, Damian Garland, and Deb Wilde.

References
- Engelmann, P., Dawkins, E., Shoemaker, J., Monfore, M. (1996). Predicting the performance of copper alloy mold cores. Plastics Engineering, vol. 52 (10), pp. 35-37.
- Engelmann, P., Dawkins, E., Shoemaker, J., Monfore, M. (1997). Improved product quality and cycle times using copper alloy mold cores. Journal of Injection Molding Technology, vol. 1 (1), pp. 18-24.
- Engelmann, P., Dawkins, E., Dealey, R., & Monfore, M. (1998). Getting heat out of the mold where water won't go. Technical Papers, vol. 44, pp. 836-840, Brookfield, CT: SPE.
- Shoemaker, J., Engelmann, P., & Dawkins, E. (1998). Cooling prediction of non-watered copper and steel cores. Technical Papers, vol. 44, pp. 841-845, Brookfield, CT: SPE
- Hayden, K., Engelmann, P., Dealey, R., & Monfore, M. (1999). Mold wear vs. wall thickness: Critical information for thin wall molding. Technical Papers, vol. 45, pp. 1063-1067, Brookfield, CTSPE.
- Engelmann, P., Hayden, K., Dealey, R., & Monfore, M. (2000). Understanding wear mechanisms: the key to mold life. Technical Papers, vol. 46, pp. 952-956, Brookfield, CT: SPE.
- Trahan, J.S., Hayden, K., Engelmann, P., Monfore, M. (2000). Impact of fines separation on reinforced thermoplastic regrind. Technical Papers, vol. 46, pp. 2908-2912, Brookfield, CT: SPE.
- Guichelaar, P.J., Wilde, D.A., Williams, M.W. (2000). The detection and characterization of blisters on carbon-graphite mechanical seal faces. Tribology Transcriptions, vol. 43, pp. 395-402.