Tensile Strength is the maximum stress a material will sustain with uniform elongation. At that stress, the onset of necking will occur and will continue until the specimen fractures. This fracture will generally occur at the point of necking.
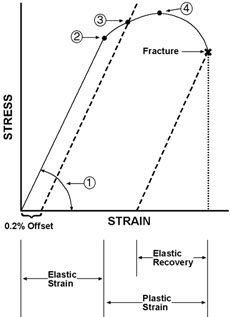 Because of the construction of the stress-strain curve (left), tensile strength is equal to the maximum stress on the curve, shown as point (4). Tensile strength is then calculated by dividing the maximum load by the cross-sectional area of the specimen, yielding a value expressed as pounds per square inch (psi), kilo-pounds per square inch (ksi) or Newtons per square millimeter (N/mm2). A standard test specimen for strip materials would be approximately 8" long, 2.0" wide at either end and 0.5" wide at the narrowest point, in the center section of the specimen. A detailed description of both the standard specimen and the test procedure is can be found in ASTM Standard E8.
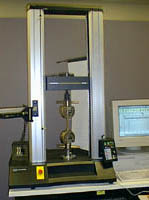 Copper speciment in Instron tensile tester with video extensometer.
Photo Courtesy of Instron Corp.
The tensile strength for different tempers of alloy C26000 are shown in Tables 1 and 2.
In general, the addition of alloying elements to copper increases tensile strength, yield strength and the rate of work hardening. All three of these properties will affect forming characteristics. An example of the effect of alloying is shown in Table 3 . Tensile strength and yield strength both increase as the zinc content increases, except that yield strength levels off when zinc content is between 30% and 35%. Maximum elongation also occurs in the range of 30% to 35% zinc.
When added to copper, different alloying elements will vary in their effectiveness at increasing strength and also in their effect on other specific properties.
| Temper Grain Size | Tensile Strength ksi | Yield Strength (0.5% Ext.) ksi | Elongation in 2.0 inches, % |
|---|---|---|---|
| 0.070 mm | 46.0 | 14.0 | 65 |
| 0.050 mm | 47.0 | 15.0 | 62 |
| 0.035 mm | 49.0 | 17.0 | 57 |
| 0.025 mm | 51.0 | 19.0 | 54 |
| 0.015 mm | 53.0 | 22.0 | 50 |
| Eight Hard | 50.0 | 35.0 | 43 |
| Quarter Hard | 54.0 | 40.0 | 23 |
| Rolled Temper | Nominal Reduction % | Tensile Strength ksi | Yield Strength (0.5% Ext.) ksi | Elongation in 2.0 inches % |
|---|---|---|---|---|
|
H01 ¼ Hard |
11 | 54 | 40.0 | 43.0 |
|
H02 ½ Hard |
21 | 62 | 50.0 | 23.0 |
|
H04 Hard |
37 | 76 | 60.0 | 8.0 |
|
H06 Xtra Hard |
50 | 86 | 62.0 | 5.0 |
|
H08 Spring |
60 | 94 | 62.0 | 3.0 |
| Alloy Number | Zinc Content % | Tensile Strength (ksi) | Yield Strength (ksi) | Elongation % |
|---|---|---|---|---|
| C21000 | 5.0 | 42.0 | 32.0 | 25 |
| C22000 | 10.0 | 45.0 | 35.0 | 25 |
| C23000 | 15.0 | 50.0 | 39.0 | 25 |
| C24000 | 20.0 | 53.0 | 40.0 | 30 |
| C26000 | 30.0 | 54.0 | 40.0 | 43 |
| C27000 | 35.0 | 54.0 | 40.0 | 43 |