Results and Discussions (cont'd)
Ionic Copper
As previously mentioned, the observed reduction in ionic copper concentration between Sampling Station 1, the New Copper Roof, and Sampling Station 2, the Roof Drain is 54%, as can be seen in Table 2. This is attributed to not only interaction with the iron and concrete stormwater system piping as well as with dissolved organic carbons (DOC) in the water, as well as other organic matter and debris. Decaying leaves and other organic matter may also complex with ionic copper. As an aside, an organic granular stormwater filter media for metals, based upon humus from collected decidous leaves is available11.
However, as the stormwater flows on through the system and over the weir at the stream an even more dramatic reduction in ionic copper is seen. When the ionic copper concentration of Sampling Stations 1, the New Copper Roof and 2, the Roof Drain is compared with Sampling Station 5, the Stream, the reduction is almost 100%. This is a result of not only dilution but also the strong tendency of ionic copper to complex and bind. The ionic copper is the form of copper which adversely affects sensitive aquatic organisms. Binding or complexing renders the ionic copper unavailable and thus benign to the environment. Note that a weak first flush can be seen on the left side of Figure 8, for total copper concentration as measured at Sampling Stations 3, 4 and 5. However, no first flush is seen at Sampling Stations 3 and 5 on the right side of Figure 8 for dissolved copper (which contains ionic copper). This implies that ionic copper has a high driving force to bind or complex. A slight first flush can be seen on the right of Figure 8 at Sampling Station 4, and is attributed to the short residence time of flowing rain on the surface of the parking lot, as a result of inadequate or incomplete complexing of the ionic copper. Note that the 0.39 µg/L ionic copper concentration for Sampling Station 4, as shown in Table 2, supports the concept of inadequate complexing of ionic copper in the Parking Lot.
Some of the key parameters measured in the collected rain, and at the 5 sampling stations within the watershed, are shown in Table 4. The mean pH of the rain is 4.7, but increases to 6.2 at Sampling Station 1, the New Copper Roof Downspout, and increases further to 7.2 at Sampling Station 5, the Stream. When acid rain falls on the copper roof, it releases ionic copper. It has been reported7 that the first rain to fall has the lowest pH and pH subsequently increases. This low initial pH acid rain also contributes to the first flush observed in both Table 3 and Figure 7, as does the dissolution of neutral copper salts formed by acid gases, as previously mentioned.
| Concentration (µg/L) | Sampling Station | |||||
|---|---|---|---|---|---|---|
| Rain | 1 New Roof | 2 Roof Drain | 3 Lawn Area | 4 Parking Lot | 5 Stream | |
| Total Cu | 3.5 | 3630 | 1340 | 20 | 16 | 46 |
| Dissolved Cu | 3.5 | 3340 | 1210 | 9 | 8 | 14 |
| Ionic Cu | <0.05 | 1730 | 802 | <0.05 | 0.39 | <0.05 |
| Total Ca | 1670 | 882 | 2094 | 10345 | 6480 | 15129 |
| Total Mg | 217 | 163 | 347 | 2394 | 1586 | 3981 |
| DOC | - | 2360 | 1230 | 2880 | 1975 | 1900 |
| Total Hardness (as CaCO3) |
43 | 1,050 | 3,340 | 22,000 | 8,150 | 32,500 |
| Toxicity (LC50%) | >100 | <0.62 | <0.62 | >100 | >100 | >100 |
| pH | 4.7 | 6.2 | 6.0 | 6.9 | 6.3 | 7.2 |
At a pH above 6, copper forms stable hydroxide complexes in water12,13 and is less available. Beyond pH, several other trends are also apparent from Table 4. Copper, as well as calcium and magnesium are present in the rain. However, when these concentrations are compared at the sampling stations in the direction of water flow through the watershed, copper decreases, while calcium and magnesium generally increase. Note that the calcium and magnesium (as well as hardness) are higher at the Lawn Area than the Parking Lot as would be expected because of the high surface area and nature of soil. Hardness values, to which calcium and magnesium contribute, also generally increase in the direction of flow.
DOC, which was present at all 5 sampling stations, reduces ionic copper in solution by complexing it. Furthermore, both calcium and magnesium compete with ionic copper for binding sites on the gills of fish or other biotic ligands 14,15 which are binding sites at which ionic copper can potentially cause toxicity. Hence, high pH values, as well as high hardness and DOC all favor binding and/or complexing ionic copper resulting in the reduction in the availability and bioavailability of ionic copper. This was confirmed in the acute toxicology tests performed on neonatal Daphnia pulex, a small aquatic organism about the size of the head of a pin, which is very sensitive to ionic copper, and is shown in Figure 9. Acute toxicity values are commonly expressed in terms of LC50, which is the concentration, of ionic copper in this case, at which 50% survival is seen after a 48 hour exposure. By convention, 50% survival (after 48 hours) equates to an LC50 of 100%.
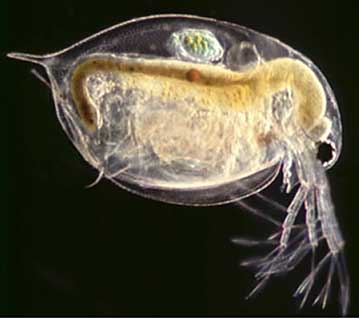 Figure 9. Enlarged Micrograph of Daphnia pulex (adult). Actual size is about that of the head of a pin.
At Sampling Stations 1 and 2, which drain the copper roof and where ionic copper concentration is the highest, survival, as expected, was very low, and the LC50is < 0.62% at both locations, as shown in Table 4. At Sampling Stations 3, 4 and 5 which are, respectively, the Lawn Area, the Parking Lot, and the Stream, ionic copper concentrations are below 1 µg/L and LC50 > 100% as is also shown in Table 4 and most samples exhibited 100% survival. The ionic copper coming off the roof does not want to remain in the ionic state and readily binds to the cast iron and concrete piping system. DOC, which is found at all sampling stations complexes with the ionic copper. As the water flows through the storm system, the pH and hardness increase. Furthermore, both magnesium and calcium compete with the ionic copper at biotic ligands. The net result of these interactions is that the ionic copper is either reduced or rendered benign to the environment. Thus the bioavailability of the copper is reduced.
Watershed Copper Mass Balance
It can be shown, based upon the rainfall and copper concentration, that the rain alone contributes 33 g of copper to the entire watershed during an average storm event. Based upon the allocation of the land use shown in Figure 1, rain deposits 18 g of copper on the lawns, 6 g on the non-copper roofs, 9 g on the paved areas and almost zero on the copper roof.
The mean copper mass balance from the various sources was calculated from the product of the mean concentration (Table 4) and the mean flow (left hand side of Table 5) and is presented in Table 5. Note that neither the flow of the rain itself nor the flow of the new copper roof downspout (which flows without other contributions or dilutions to the roof drain) were not added to that of the other sampling stations listed in Table 5. This is to avoid double counting.
| Sampling Station | Mean Flow (m3) | Copper Flux (g) | ||
|---|---|---|---|---|
| Total | Dissolved | Ionic | ||
| 2. Roof Drain | 42 | 56 | 51 | 34 |
| 3. Lawn Area | 3500 | 70 | 32 | 0 |
| 4. Parking Lot | 2720 | 44 | 22 | 1 |
|
Total
|
6262 | 170 | 104 | 35 |
| 5. Stream | 9320 | 429 | 130 | 0 |
The average rainfall over the 16 storm events, which had an average duration of 7.9 hours, was 20.1 mm. It therefore follows that the average volume of rain for each storm is 9347 m3. This is in close agreement with the volume of water that flows over the weir at the stream, which is 9320 m3, as shown in Table 5. However, the sum of the flow measured at the sampling stations is 6262 m3, which is less than the stream volume of 9320 m3. This shortfall is attributed to other sources of flow within the watershed, which were not monitored.
The sum of the flux for total copper, based upon the measurements at the sampling stations prior to the stream is 170 g of copper. This is less than half of the amount calculated at the stream which is 429 g and again the shortfall is attributable to other sources not measured. Closer agreement is seen between the sum of the dissolved copper values from the sampling stations, at 105 gm and the stream at 130 g.
Although these copper flux values present an imperfect and incomplete picture of the sources of all the copper within the watershed, it can be seen from Table 5 that, based upon the available data, the Lawn Area, with a total copper flux of 70 g, is the largest source of copper, followed by the new copper roof at 56 g, and the Parking Lot at 44 g. Although the non-copper roofs were not sampled, their copper contribution at 6 g is assumed to be solely from rainfall.
The Old Roof
The 1258 m2 old copper roof installed in 1931 at the Chapel Annex at Trinity College in Hartford, Connecticut is shown in Figure 10(a). Sampling Station 6, at the Old Copper Roof Downspout is shown in Figure 10(b). In Table 2, it is apparent that total copper, dissolved copper and ionic copper concentrations for the old roof are lower than the corresponding values for the new roof. This is in contrast to the observation made in Sweden16 on a 130 year-old naturally patinated copper sheet and a new copper sheet during a four year exposure. Differences in roof geometry, orientation and climate may account for this difference. Both roofs in Connecticut have approximately the same orientation, west-northwest for the old roof and northwest for the new roof and both are exposed to very similar weather including precipitation, due to their close proximity. However, the new roof at UCONN is a curved arch with a variable inclination and the old roof at Trinity College is peaked and inclined at 42°. The effect of exposure direction and inclination on copper runoff has been reported by others17. Residence time of rain on the two roofs in Connecticut differs and may play a roll in the observed differences7 in copper runoff.
 Figure 10(a). Old copper roof installed in 1931 on Chapel Annex at Trinity College.
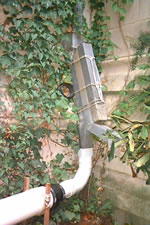 Figure 10(b). Old copper roof downspout and PVC sampling port.
Although the copper concentration values from the old roof are less than half that of the new roof, as shown in Table 2, there is another factor which would make the difference even greater. The new roof had a cast iron downspout which removes copper while the old roof has a copper downspout, which would presumably remove less copper.
Energy dispersing Analyses, in combination with Scanning Electron Microscopy (SEM) as well as X-ray diffraction (XRD), was used to determine the composition, morphology and crystal structure of corrosion product found on the surface of each roof. The corrosion products on the two roofs were indistinguishable in chemical composition and consisted of copper, sulfur and oxygen. Linear striations, which may be attributable to mill processing and fabrication, are still visible on the new roof as can be seen in the SEM image is shown in Figure 11(a). In contrast, the SEM image for the old roof, as shown in Figure 11(b), shows a uniformly mottled appearance. XRD confirms that cuprite (Cu2O) is present on the new roof. The duration of the existence of cuprite as the dominant phase and the subsequent formation of brochantite (Cu4SO4(OH)6) varies with location and air quality. Brochantite has been observed after only three months of exposure in France18 but cuprite remains the dominant phase after a two year exposure in Sweden19 and after eight years in Connecticut, as shown in this study. The old roof contains both cuprite and brochantite and small amounts of posnjakite (Cu4SO4(OH)6 • H2O), which is consistent with the observations of others20 and as expected, forms above the cuprite.
Figure 11. SEM Surface Scans of 1993 installed (Station 1) and 1931 installed (Station 6) copper roof at different magnifications; A is a scan of the two roof surfaces at 11X magnification (1993 roof on right and 1931 roof on left), B (1500 X) and C (150X) are scans of the 1993 installed roof, D (1100X) is a scan of a surface Brochantite cluster, while E (1500X) and F (150X) are scans of the 1931 installed roof.
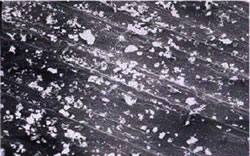 Figure 11(a). New copper roof at 150X magnification.
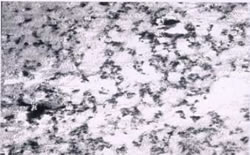 Figure 11(b). Old copper roof at 160X magnification.
Kramer et al7, utilizing geochemical modeling indicate that the solubility of brochantite is lower than that of cuprite and that the solubility of both of these compounds decreases as pH increases. Hence one would anticipate, based on this pH solubility relationships, that as rain acidity decreases (pH increases), less copper should be released. The same authors also report7 that the corrosion product thought to be the terminal phase (formed on the copper) has lower solubility than its precursor phases. Thus brochantite, the terminal phase 20, should exhibit somewhat lower solubility and, therefore contribute less to runoff than cuprite. This favors and is consistent with the observation that copper concentrate in runoff is lower on the old roof when compared to the new roof. Others have also attributed a reduction in copper runoff to patina formation21, 22.
| Previous... | Next... |