Results and Discussions
Watershed and Sampling Stations
Figure 1 shows a plan view of the UCONN 46.5 hectare watershed at Storrs. The largest land use are the lawns at 54.6%, followed by the paved areas at 27.5%, the non-copper roof areas at 17.7% and the copper roof at 0.2%. The Sampling Stations, 1 through 6 are identified in Table 1. Sampling Stations 1 through 5 are within the UCONN watershed while Sampling Station 6 is at the Annex of the Chapel at Trinity College nearby in Hartford, Connecticut.
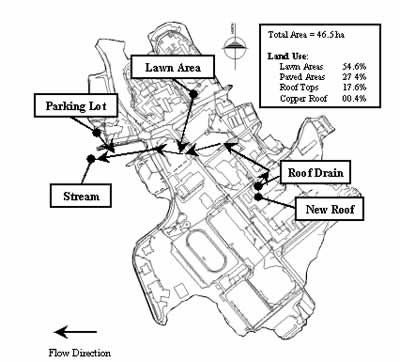 Figure 1. University of Connecticut watershed, showing locations of sampling stations, flow direction and land use.
| Sampling Station | Measurement Location |
|---|---|
| 1. New Roof | New Copper Roof Downspout |
| 2. Roof Drain | Roof Drain at the Street |
| 3. Lawn Area | North Campus Lawn Area |
| 4. Parking Lot | Police Station Parking Lot |
| 5. Stream | Stream Exiting Campus |
| 6. Old Roof | Old Copper Roof Downspout |
The copper roof at UCONN was installed in 1992 on the Castleman Engineering Building. It consists of a segment of an arch, as can be seen in Figures 2(a), (b) and (c). The total area of the copper roof is 1800 m2 although the runoff of only half of the roof was measured at Station 1. The total area of the roof of the Castleman Engineering Building, including the non-copper areas, is 2200m2.
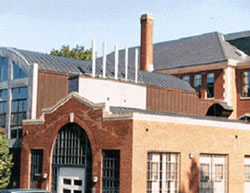 Figure 2(a). New copper arched roof shown in upper left, as viewed from front of building.
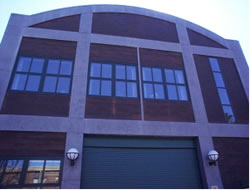 Figure 2(b). New copper arched roof span, as viewed from back of building.
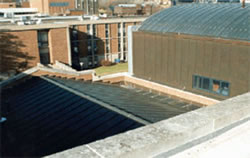 Figure 2(c). New copper arched roof shown in upper right, as viewed from back of building.
The stormwater runoff from the entire roof was collected at Sampling Station 1, the New Copper Roof Downspout, as shown in Figure 3(a). A long horizontal polyvinyl chloride (PVC) pipe has been installed at the end of the cast iron downspout. This is to dissipate the potential energy of the water leaving the copper roof 80 feet above the sampling station. This collection system configuration facilitates accurate flow measurement and insures uniform water volume collections. The stormwater from the entire roof complex flows through the storm drain located directly outside the building at the street curb, where it connects with the watershed stormwater system. Measurements are made at this point, Sampling Station 2, the Roof Drain at the Street. Note the protective box which houses the instrumentation and sample bottles as well as the road drain grating shown in Figure 3(b), which is Sampling Station 2.
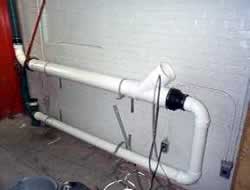 Figure 3(a). Bottom of new copper roof downspout.
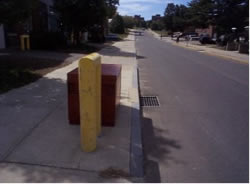 Figure 3(b). New copper roof drain at the street.
Sampling Station 3 collects the stormwater runoff from the North Campus Lawn Area , as shown in Figure 4(a). The light circle on the left of the figure is a manhole cover used to facilitate sample collections from the stormwater system. Sampling Station 4 collect stormwater runoff from the asphalt paved Parking Lot and is shown in Figure 4(b). A manhole is also used to facilitate sample collections from the watershed stormwater system at this station. The stormwater system from the watershed drains into a natural stream exiting the campus. The view from upstream of the concrete weir, which spans the stream and is used for flow measurement, is shown in Figure 5(a). Note the vertical PVC sampling ports on the right side. This is Sampling Station 5 and is described as Stream Exiting Campus. Figure 5(b) is a side view of the weir during a heavy rain event.
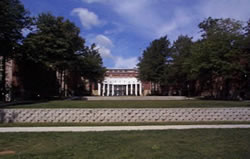 Figure 4(a). North Campus lawn area.
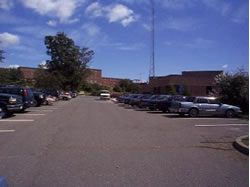 Figure 4(b). Police Station parking lot.
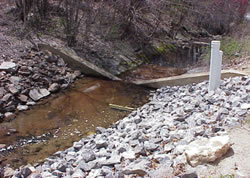 Figure 5(a). Weir across the stream.
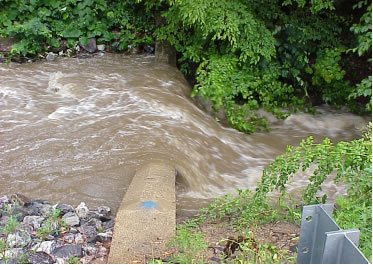 Figure 5(b). Weir during heavy rain.
Copper Concentration
The overview of the watershed and its five sampling stations is shown in Figure 6. The mean and standard deviation, for total, dissolved and ionic copper concentration, as measured over 16 storms at Sampling Stations 1 through 6 is shown in Table 2. The average rainfall was 20.1 mm during the 16 storm events, which lasted an average of 7.9 hours. As previously mentioned, dissolved copper is a measurement of all the copper passing through a 0.45 µm filter. Thus it includes both fine (<0.45µm) particles and ionic copper. Thus dissolved copper is always greater than and should not be considered to be the same as ionic copper when fine (<0.45 µm) copper particulates are present. Sampling Station 6 and its associated data, will be discussed separately because it resides in a different watershed, at Trinity College in Hartford, Connecticut.
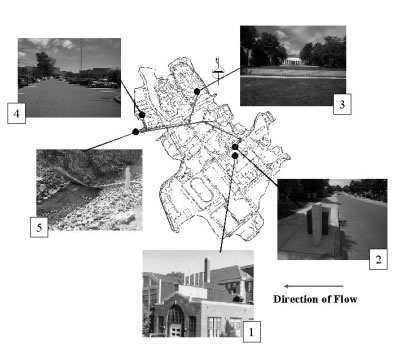 Figure 6. Overview of watershed showing locations of the sampling stations, where (1) is the new copper roof, (2) is the roof drain, (3) is the lawn area, (4) is the parking lot, and (5) is the stream.
| Sampling Station | Total Copper | Dissolved Copper | Ionic Copper |
|---|---|---|---|
| (µg/L) | (µg/L) | (µg/L) | |
| 1. New Roof | 3630 +/- 1760 | 3340 +/- 1520 | 1730 +/- 900 |
| 2. Roof Drain | 1340 +/- 820 | 1210 +/- 840 | 802 +/- 170 |
| 3. Lawn Area | 20 +/- 8 | 9 +/- 2 | <0.05 |
| 4. Parking Lot | 16 +/- 6 | 8 +/- 2 | 0.39 +/- 0.2 |
| 5. Stream | 46 +/- 26 | 14 +/- 7 | <0.05 |
| 6. Old Roof | 1460 +/- 840 | 1340 +/- 760 | 620 +/- 380 |
The average initial total copper concentration values from the three copper roof monitoring locations, Sampling Station 1, 2 and 6 are much higher than the mean values measured over the entire storm as shown in Table 3. This high initial value is called the first flush phenomenon and has been previously observed in roof runoff 2-6. First flush has been attributed to the removal of neutral copper salts which form during dry periods by the reaction of copper with acid gases of sulphur and nitrogen present in the atmosphere 7. The first flush phenomenon can also be seen in Figure 7 for both total and dissolved copper.
| Sampling Station | Initial (µg/L) | Mean (µg/L) |
|---|---|---|
| 1. New Roof | 6703 +/- 3801 | 3630 +/- 1760 |
| 2. Roof Drain | 2296 +/- 1367 | 1340 +/- 820 |
| 3. Old Roof | 3838 +/- 1561 | 1460 +/- 840 |
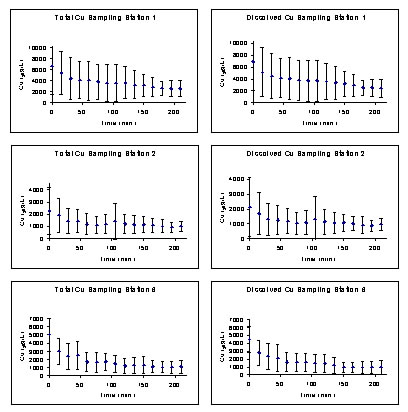 Figure 7. Average and standard deviation of flow-weighted total and dissolved copper concentrations for sampling stations, where (1) is the new copper roof, (2) is the roof drain, and (6) is the old copper roof.
A comparison of the copper concentrations observed at the New Roof (Sampling Station 1), and the Roof Drain (Sampling Station 2), show that both total and dissolved copper concentrations are reduced by about 63%, while ionic copper concentrate is reduced by 54%, as shown in Table 2. Since the non-copper area of the roof is 18% of the total area, this reduction can only account for, at most, approximately 20% or a fifth of the observed reduction. It is hypothesized that the balance, or approximately 80% of the observed reduction is attributable to interaction with the cast iron and concrete drain pipes. This interaction of copper with the drainage system has important implications in regard to mitigation of copper runoff. Concrete has been shown to collect copper from roof runoff 8. Others have reported that iron surfaces have been shown to be responsible for a significant reduction of copper levels over a short period of time9,10. This suggests that passing roof runoff through filters containing iron filings may be an effective way to reduce copper release of the environment.
Sampling Station 3, the Lawn Area and Sampling Station 4, the Parking Lot exhibit total and dissolved copper concentration values which are approximately two orders of magnitude lower than that of Sampling Station 1, the New Copper Roof, and Sampling Station 2, the Roof Drain, as shown in Table 2 and Figure 8. Note that a weak first flush can be seen for total copper, on the left of Figure 8 but not for dissolved copper as shown on the right of Figure 8. The background total copper concentration measured between storm events at Sampling Station 5, the Stream, was 18 +/- 6 µg/L. This is similar to, but less than the concentration observed at Sampling Station 3, the Lawn Area, which is 20 +/- 8 µg/L. This suggests that baseline flow between storm events may be a result of slow continuous drainage through the soil of grassy areas. Sources of copper at Sample Station 3, the Lawn Area include the rain itself and, potentially, pesticides and synthetic fertilizers . Sampling Station 4, the Parking Lot, is an unlikely source of this continuous flow as it does not have the ability to retain a significant amount of water as does the soil in the grassy areas. Sources of copper at Sample Station 4, the Parking Lot, are rain, and possibly, automobile fluids and brake pad dust.
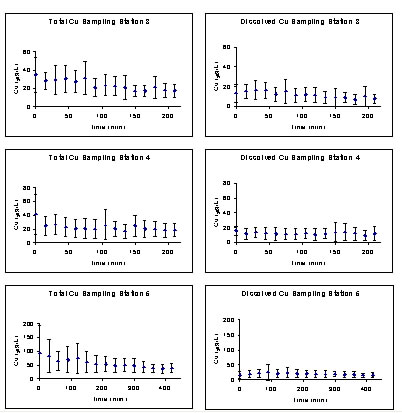 Figure 8. Average and standard deviation of flow-weighted total and dissolved copper concentrations for sampling stations, where (3) is the lawn area, (4) is the parking lot, and (5) is the stream.
| Previous... | Next... |