Abstract
The movement to design plastic products with thinner walls has raised many issues for molders. Using a glass-reinforced resin in high-shear applications can decrease the resin's physical and mechanical properties. Understanding where the breakdown occurs in the molding system is fundamental in designing thin-walled plastic products. Changes in glass fiber lengths were measured at various locations in the delivery system to the part, over several material generations. This information was developed in conjunction with the data collection for the long-term wear study of copper alloy mold components. A procedure was developed for prediction, testing and measurement of fiber length in a thin-wall application.
Background and Introduction
Pressure to manufacture plastic products that are lighter, quicker, and cheaper has led many designers and molders to employ thinner walls in parts. Reducing wall thickness can reduce a part's ability to meet stringent structural requirements. Furthermore, the high-shear environments often needed to facilitate flow in the mold cavity and prevent premature freezing of the polymer melt create higher residual stresses. Intuitively, the industry compensates for thinner walls by adding reinforcements, such as glass to the resin (1). What may be overlooked in this movement to produce thinner products is the relationship between glass fibers and the delivery system geometry to the part geometry.
The work detailed here is an outgrowth of long-term research at Western Michigan University. As part of the investigation into wear mechanisms associated with injection molds, it became necessary to run 1.5 million cycles of glass-filled nylon 6. Both from an economic and ecological standpoint, it was unthinkable to do this project with virgin resin.
An important goal of the wear study included reusing the glass-filled nylon 6 resin as many times as possible without negatively affecting the wear research. In other words, the primary medium of wear, the glass fibers needed to be monitored during the study. A previous study by Western Michigan University investigated the effects of the separation of fines from regrind on the glass content (by weight) in the resin (2). Although, the change in glass content was ruled non-significant, a positive correlation between tensile strength and material generations was observed. This implied that a change in glass fiber length might be occurring with each recycled generation of material. This was viewed as an opportunity to explore where the breakdown of glass fibers occurs in the molding system.
Past research has suggested that screw recovery and the use of reground material affect part performance due to excessive glass fiber breakage (3). For that reason, it became necessary to identify other potential areas in the injection molding process that were key contributors to the fracturing of fibers. The effects of the molding process on the resin could be logically divided into four stages to determine where fiber breakdown occurred.
Statement of Theory
One potential location in the molding system thought to break glass fibers was the gate. According to Honeywell, the glass fibers are 4.76 mm (.187) long prior to compounding. An edge gate used to generate high amounts of shear measured 0.76 mm by 0.76 mm (.03 x .03) and had a land length of 1.27 mm (.05)
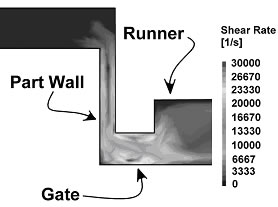 Figure 1. Shear rate of material through the gate.
Description of Equipment
The material used was 33% glass-filled nylon 6 (Capron 8233G HS BK-106) supplied by Honeywell. Molding was conducted on a 77 metric ton (85-ton) hydraulic toggle injection-molding machine. The parts were formed by an eight-cavity wear mold. They were 1.5 mm (.06) thick round chips with a diameter of 19 mm (.75). The parts had a 5 mm (.20) high wall running around their diameter. The shot weight was approximately 18.0 grams (.635 oz.) and the cycle time was about 6.0 seconds. The delivery system consisted of a DME straight-shot hot sprue bushing, two P-20 runner bars, and one edge gate per part.
The parts and runners were fed into a nine-blade Conair auger-fed grinder with a screen size of 5 mm (3/16) via a conveyor belt and deposited into a container. Resin loading was done with an AUTOLOAD hopper loader, with a Herbert static controller to de-ionize the regrind.
Burn tests were conducted in a Thermolyne 1400 furnace with ceramic crucibles. Glass fibers were prepared in glass petri dishes. A Nikon microscope and Snappy hardware and software (version 3.0) were used to capture images of the fiber samples. Fiber lengths were measured with Image-Pro Plus for Windows software (version 1.3).
Experimental Design
Independent variables for the fiber length experiment included material location and material generation. The material location included the following treatments: pre-barrel, post-barrel, pre-gate, and post-gate. The treatments for material generation were as follows: virgin, generation one, and generation two. Grinding the parts molded from virgin resin produced the subsequent material generations. All other process and molding factors were held constant. The response or dependent variable was fiber length. The combinations of material location and generation were fully cross-classified.
Material samples for each treatment combination were molded the same day. The various generations were run sequentially; however, after each run, natural Dupont Zytel with purging compound (unfilled PA 6/6) was purged to reduce contamination between samples. The auger grinder was also cleaned between runs.
Six pre-barrel material samples were randomly collected prior to each molding process as a virgin or regrind condition. Following a stabilization period for each material generation, six shots were randomly collected to obtain pre-gate and post-gate material samples. Post-barrel samples were gathered sequentially at the end of the run for each material generation. The barrel was immediately retracted and material was injected forward at 0.1 inches/second onto a metal probe. The probe was used to slowly draw a strand of resin until a diameter near the original pellet was achieved. All material samples were collected and conditioned in a testing lab under ASTM D613 environmental guidelines for a minimum of 48 hours.
A heated razor blade was used to prepare the post-barrel, pre-gate, and post gate samples (Figure 2). Six post-barrel samples per strand were dissected in consecutive .125-inch increments, while pre-gate and post-gate samples were collected from all eight locations per shot. The samples were mixed per material location to avoid confounding.
 Figure 2. Pre-gate and post gate locations of the fiber samples.
Glass fibers were separated from the resin using a standard ash test procedure. The ash tests were conducted in a furnace at 482 ° C (900 ° F) for one hour. Six random material samples from each treatment were tested. The specimens were then conditioned in a testing lab under ASTM D613 environmental guidelines for a minimum of 48 hours.
Glass fibers were emptied onto a glass petri dish. Fiber samples were viewed and photographed under a microscope with a 3X lens. The microscope's platform was randomly positioned after each photograph to reduce the chance of duplicating fibers. The digital glass fiber images were processed and measured to the nearest .00001 inch using the Image-Pro software. Boundary ranges were as follows: length from .0254 mm to 50.8 mm (.001 to 2) and width from .0076 mm to 50.8 mm (.0003 to 2).
Samples were also prepared to allow evaluation of tensile performance from the various treatment groups. A gate seal experiment and process optimization was performed to set up the tensile bar molding process. Following a stabilization period, 12 tensile bars were collected per material condition. For the tensile measurements, six specimens were randomly selected from each experimental run and tested in accordance with ASTM D638. Included were four replicates of virgin material tested periodically to track and monitor experimental error. Dependent variables included tensile yield and break.
Analysis of Data
The data were analyzed using STATISTICA for Windows, release 5.5 (5). The data were analyzed using a combination of standard analysis of variance methods and graphical methods. For all histograms, a distance weighted least squares line was fit to each treatment of data to facilitate interpretation. All tests for statistical significance between treatment effects were performed at a 95% confidence interval. Mean separation tests were performed using the Scheffe method at a 95% confidence level. T-tests for independent samples at a 95% confidence level were used to compare treatments between Honeywell's measurements and WMU's measurements.
Findings
Results of mean fiber lengths for the various material generations and locations are shown in Figure 3. The data suggested a decline in glass fiber length as the material systematically progressed through the process. Six sequential treatments observed to be significant were as follows 1) pre-barrel virgin fibers to post-barrel virgin fibers, 2) post-barrel virgin fibers to virgin pre-gate fibers, 3) generation one pre-barrel fibers to generation one post-barrel fibers, 4) generation one pre-gate fibers to generation one post-gate fibers, 5) generation one post-gate fibers to generation two pre-barrel fibers, and 6) generation two pre-barrel fibers to generation two post-barrel fibers (p<.05). Other significant differences existed, but were not sequential with respect to the process flow.
 Figure 3. Mean fiber lengths of each treatment.
The data also indicated a significant difference between all treatment locations in the molding system (p<.05). After one injection molding cycle the breakdown of glass fibers began to level off as material was reused. The fibers of the same treatments measured by Honeywell showed a significant difference from the fibers measured in this study, but due to the large sample size, the difference was judged to have no practical significance (p>.05).
Results for tensile data are presented in Figure 4. The data suggest there was a significant reduction in tensile strength of the nylon resin between the virgin generation and all subsequent generations. The data suggested a significant difference between all the material conditions (p<.05). First exposure to the injection molding process reduced the average length of fibers by approximately 40%. Processing 100% first generation and 100% second generation regrind yielded an additional breakdown of about 15% and 10%, respectively. Figure 5 illustrates the fiber length differences between virgin and second generation.
 Figure 4. Tensile strength per grinding/aspirating history and material form.
 Figure 5. Comparison of glass fibers between unprocessed virgin and second-generation material in the part.
An increase in mean fiber length was detected between virgin post-gate (part) and generation one pre-barrel fibers (hopper). These changes could have been caused by a number of factors including the granulated mixture of runners and parts, material conveyance and static issues. Grinding the glass-filled nylon created many fine particles that became static charged from conveyance.
Figure 6 shows histograms for all combinations of treatment effects. The data indicated a shift from a normally shaped distribution of glass fiber lengths to an exponentially shaped distribution as material progressed through the process. The aggregate length of the fibers decreased as the resin was exposed to each portion of the process from the forces present in the barrel through shearing forces through the gate in to the part (1).
 Figure 6. Histogram of all check points in the molding system through three material conditions.
Conclusions
The importance of this study for the product designer is the implication of product and tool design on fiber breakage. Both the runner system and gate, as well as the product (product cavity) in the tool were specifically designed to increase the shear seen by the resin. This study illustrates that although 40% of the virgin fiber breakage occurred in the screw and barrel, roughly 25% was the result of runner, gate and part design. Therefore, the material strength data used to design product load capacity may substantially over-predict the actual material strength as molded. This is of particular interest when glass fiber reinforced materials are reground and reprocessed. Much attention has been focused on property changes resulting for alteration of the polymer structure. This study implies that a significant portion of the change in material properties is directly related to fiber breakage during the process.
Conventional wisdom has held that fiber length decrease in the injection mold itself was a negligible factor. In fact, these data suggest that the product designer may have more to do with the ultimate resin properties (exclusive of part geometry) than previously thought. With these data in hand it is important to verify the ultimate material strength as a result of fiber breakage and give scrutiny to each portion of the injection system and the tool with regard to potential fiber breakage points. In this case the nylon chosen was heat stabilized specifically to enhance its long-term process performance. However with the fiber data in hand the change in the material properties discussed early is more understandable. Designers are now equipped with the knowledge of predicting a product's ability to meet certain structural requirements.
Acknowledgements
The research team at Western Michigan University wishes to acknowledge Honeywell for providing the resin for the entire study and the support of the Copper Development Association Inc. Research assistance was also provided by the WMU Construction Engineering, Materials Engineering, and Industrial Design Departments.
References
- Rosato, D. (1996). Injection Molding Higher Performance Reinforced Plastic Composites. Technical Papers , vol. 42, pp. 475-479. Brookfield, CT: SPE.
- Trahan, J., Hayden, K., Engelmann, P., Monfore, M. (2000). Impact of fines separation on reinforced thermoplastic regrind. Technical Papers , vol. 46, pp. 2908-2912, Brookfield, CT: SPE.
- Allied Signal Plastics. (1995). CAPRON 8233G HS BK-106, Morrisville, NJ: Author.
- Kennedy, P., Zheng, R., Fan, X-J., Phan-Thien, N. (1998). Brownian Dynamics Simulation of Non-Dilute Fibre Suspension Flows in a Centre-gated Disk. Technical Papers , vol. 46, pp. 671-674. Brookfield, CT: SPE.
- StatSoft, Inc. (2000). STATISTICA for Windows [Release 5.5.] Tulsa, OK.